


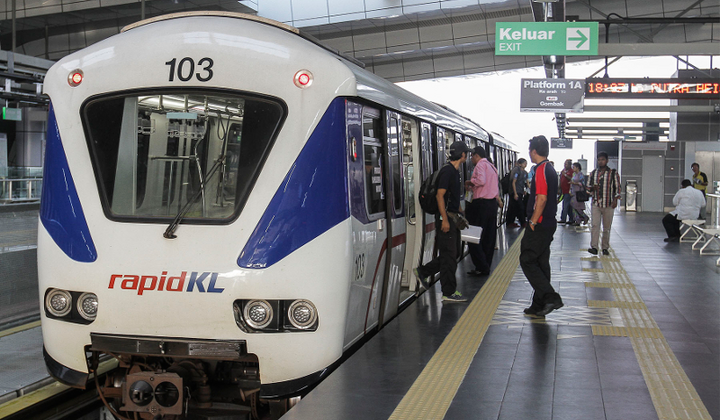
If you are living in the Klang Valley and you aren’t driving, you must have known how important public transportation is. But previously, the public have no information on how well they performed. So, the MyRapid website has two new pages that show how well or poorly the Rapid buses and rails are performing.
According to MyRapid site, the reason for creating the performance updates is:
Transparency and accountability are core values that we uphold in our operations. We believe that providing timely and accurate information to our passengers and other stakeholders is essential in continuously improving our services and identifying areas for improvements. We hope that this, in turn, will help build trust and confidence in our services.
The following are the latest performance numbers, which will serve as a roadmap for improving our services and achieving even greater success in the future.
The performance update is divided into five categories:
Ridership
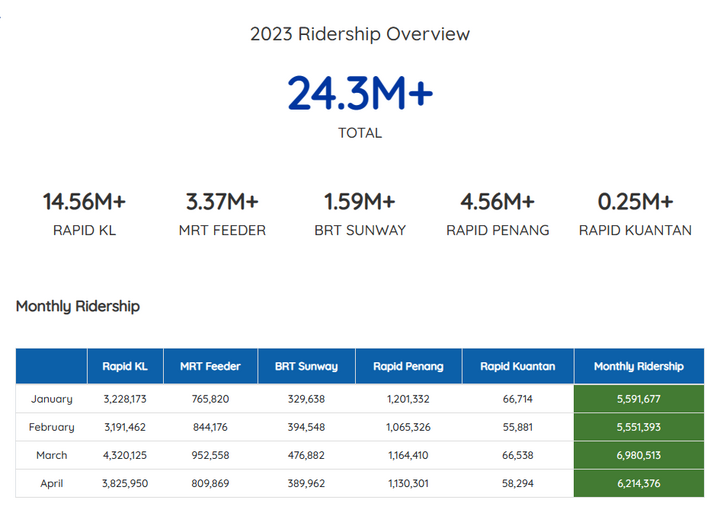
This category shows how many people are taking the buses and the rails.
Load Factor
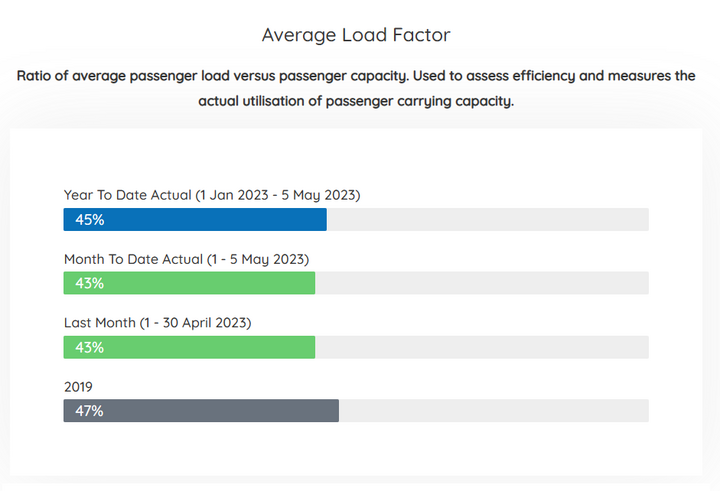
This refers to the comparison between the average number of passengers on board during peak hours and the maximum number of passengers the vehicle can carry. It is a way to evaluate how effectively the capacity of the vehicle is being utilised.
Service Reliability
For rails, Rapid is measuring the service reliability using Mean Kilometres Between Failures (MKBF). This is a metric used to assess the reliability of a railway system. It quantifies the distance travelled by trains before experiencing a failure that leads to a delay of more than 5 minutes within a 12-month period. MKBF is a measure of service performance reliability and is evaluated according to EN 50126, a globally recognised railway standard.
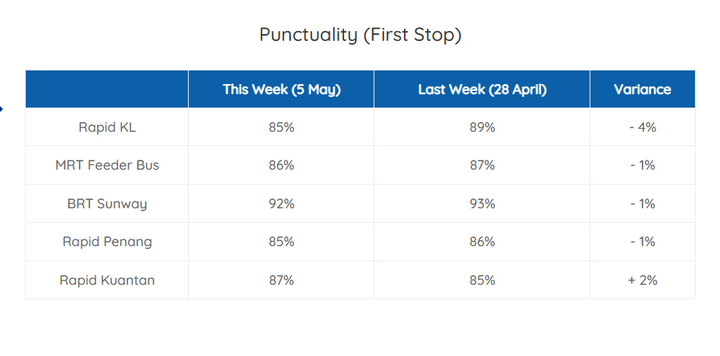
For buses, this category shows how punctual the busses are.
Service Availability
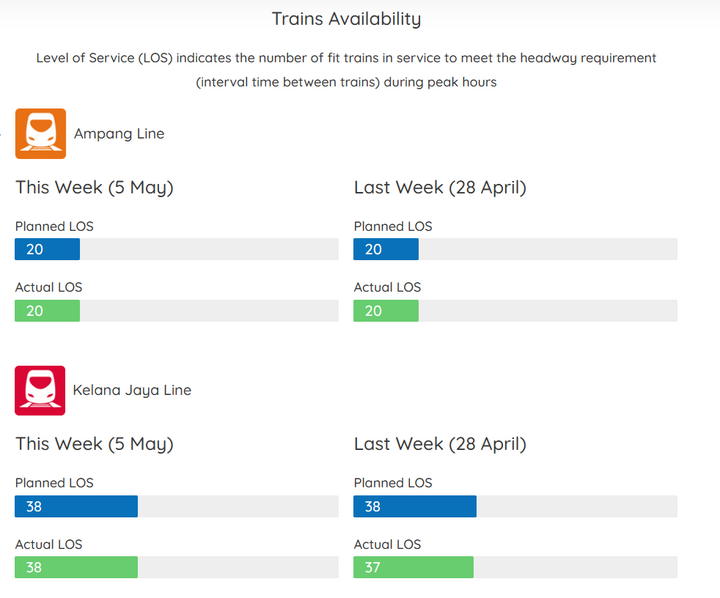
For rails, Rapid is measuring using Level of Service (LOS) to indicates the number of fit trains in service to meet the headway requirement (interval time between trains) during peak hours.
For buses, they are measuring average planned versus Actual Bus-on-the-Road (BoTR).
Facilities Update
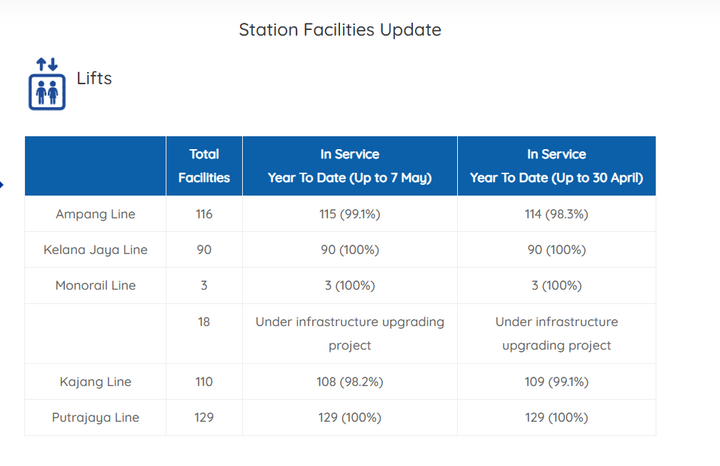
This one refers to how many lifts, escalators, lightings, and toilets are working and whether there are any leakage at Rapid rails and BRT stations.
Rapid said the performance update data will be updated weekly. If you want to read more about it, you can go to Rapid Rail Performance Update and Rapid Bus Performance Update.